Gantt Chart Image | Examples and Explanation

"Business is easy, the hard part is dealing with people".
If you've ever read this phrase and you are in the business world you will know what we are talking about. Managing teams requires patience and management skills that are not so easy to develop.
That's why we think that the Gantt chart is a tool that will be of great help to you.
It's a diagram that allows you to plan projects of different types. No matter which person is assigned the task, with the chart you will know how it is progressing and what adjustments need to be made to complete it.
How many times has it happened to you that projects are delayed due to lack of communication and organization? Well, it's time to forget about this problem.
Do you want to know how to implement it in your company? Find out below:
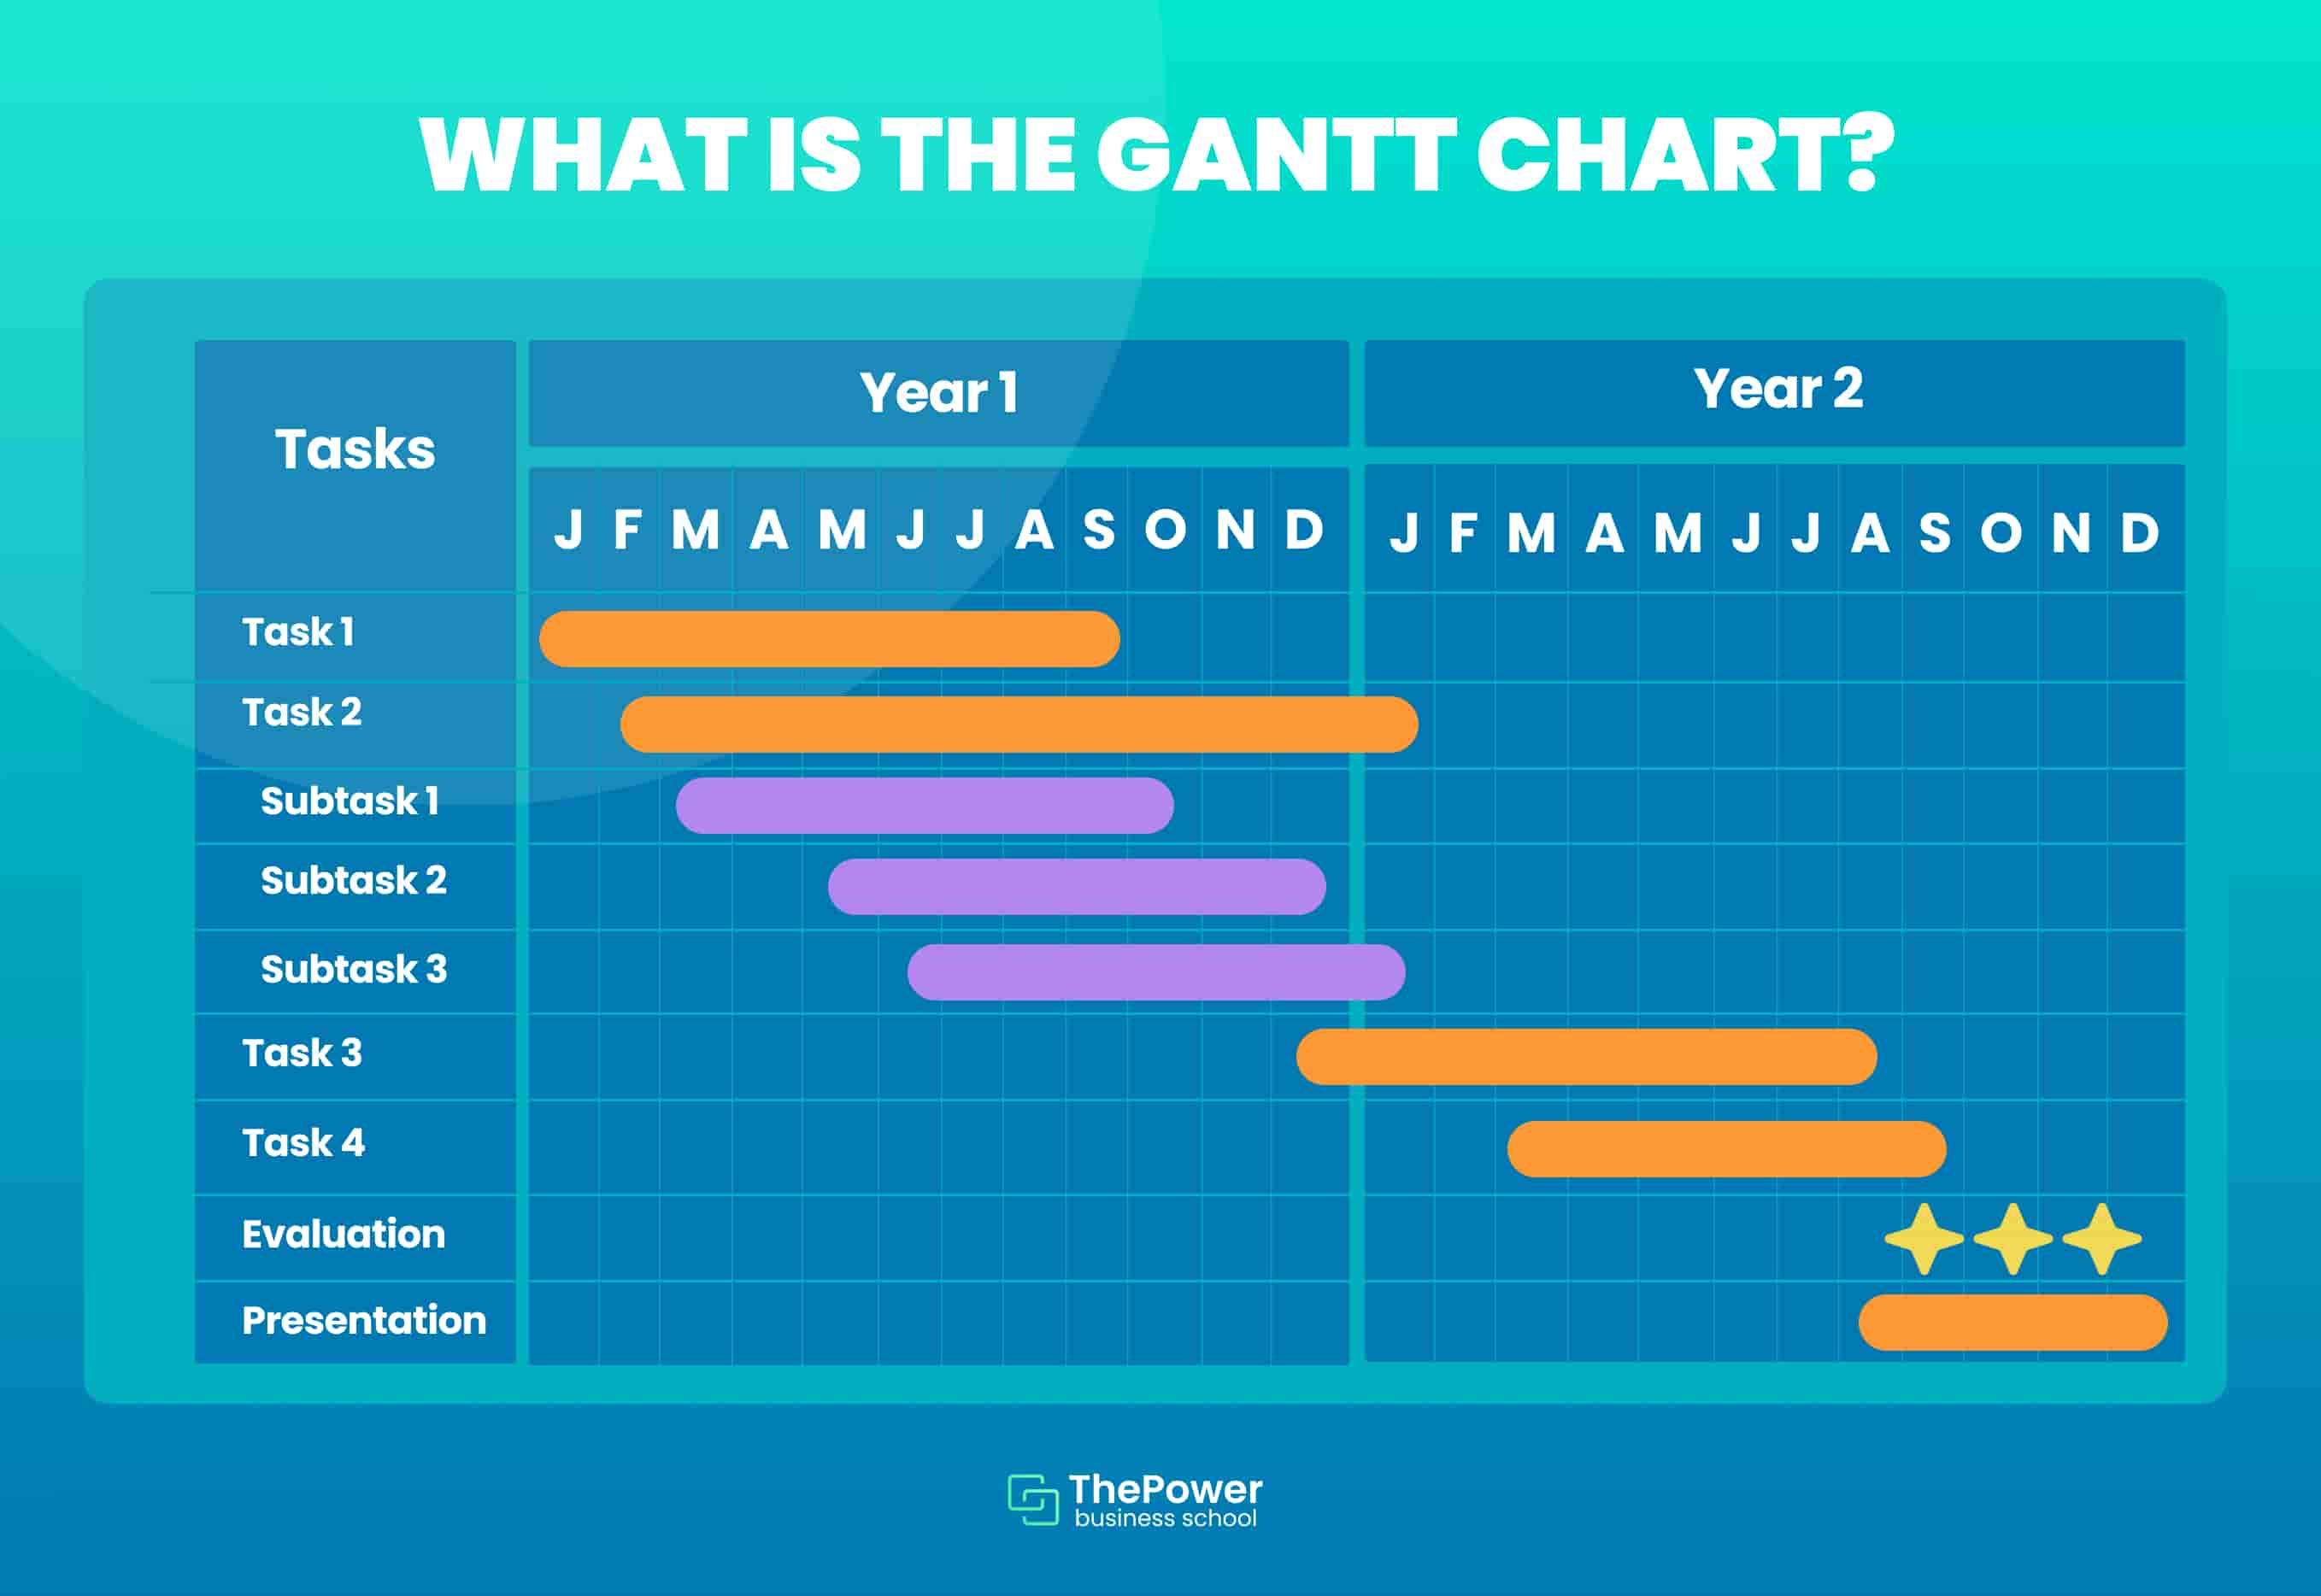
What is the gantt chart?
We define the gantt chart as a project management tool. Inside it shows you an overview of all the tasks that need to be done, who is involved and what their due date is.
Here you can see items such as:
Tasks left to complete
Start and end date of each project
Teams assigned to each area
Estimated time each task will take
Determine if there are projects that depend on others.
This way it becomes a fantastic ally for the daily management of your business. We know that on many occasions you have to manage multiple projects that have common goals.
Well, with the gantt chart you will be able to give them the follow-up they deserve.
Elements of the Gantt Chart
The Gantt chart has different components that you should be familiar with in order to understand how it works.
Discover them in the following list:
1. Dates
This is one of the most important elements. It allows you to know when each task will start and finish, which will help you to make a more optimal management of your time.
2. Tasks
Tasks often have a series of edges that should be divided in order to give them the attention they deserve.
The Gantt chart allows you to create lists of subtasks so that nothing goes unnoticed. This way you will know what is the status of the project and what is missing to finish it.
3. Time schedules
The diagram shows you the amount of time there is to deliver the project. The ideal thing is to link it to the tasks section so that you can finish one by one and everything will be more organized.
4. Independent tasks
It's true that there are tasks that you can do at any time according to your schedule.
However, there are others that can only be done before or after another project starts or finishes.
The Gantt chart will help you in this regard because it shows you which activities are priorities and which are not, so don't doubt it.
5. Progress
We love the progress box because it shows you the progress of the project you're working on.
You will know which tasks have been done and which are still to be done. You'll also see how much time you have left, so you won't miss anything.
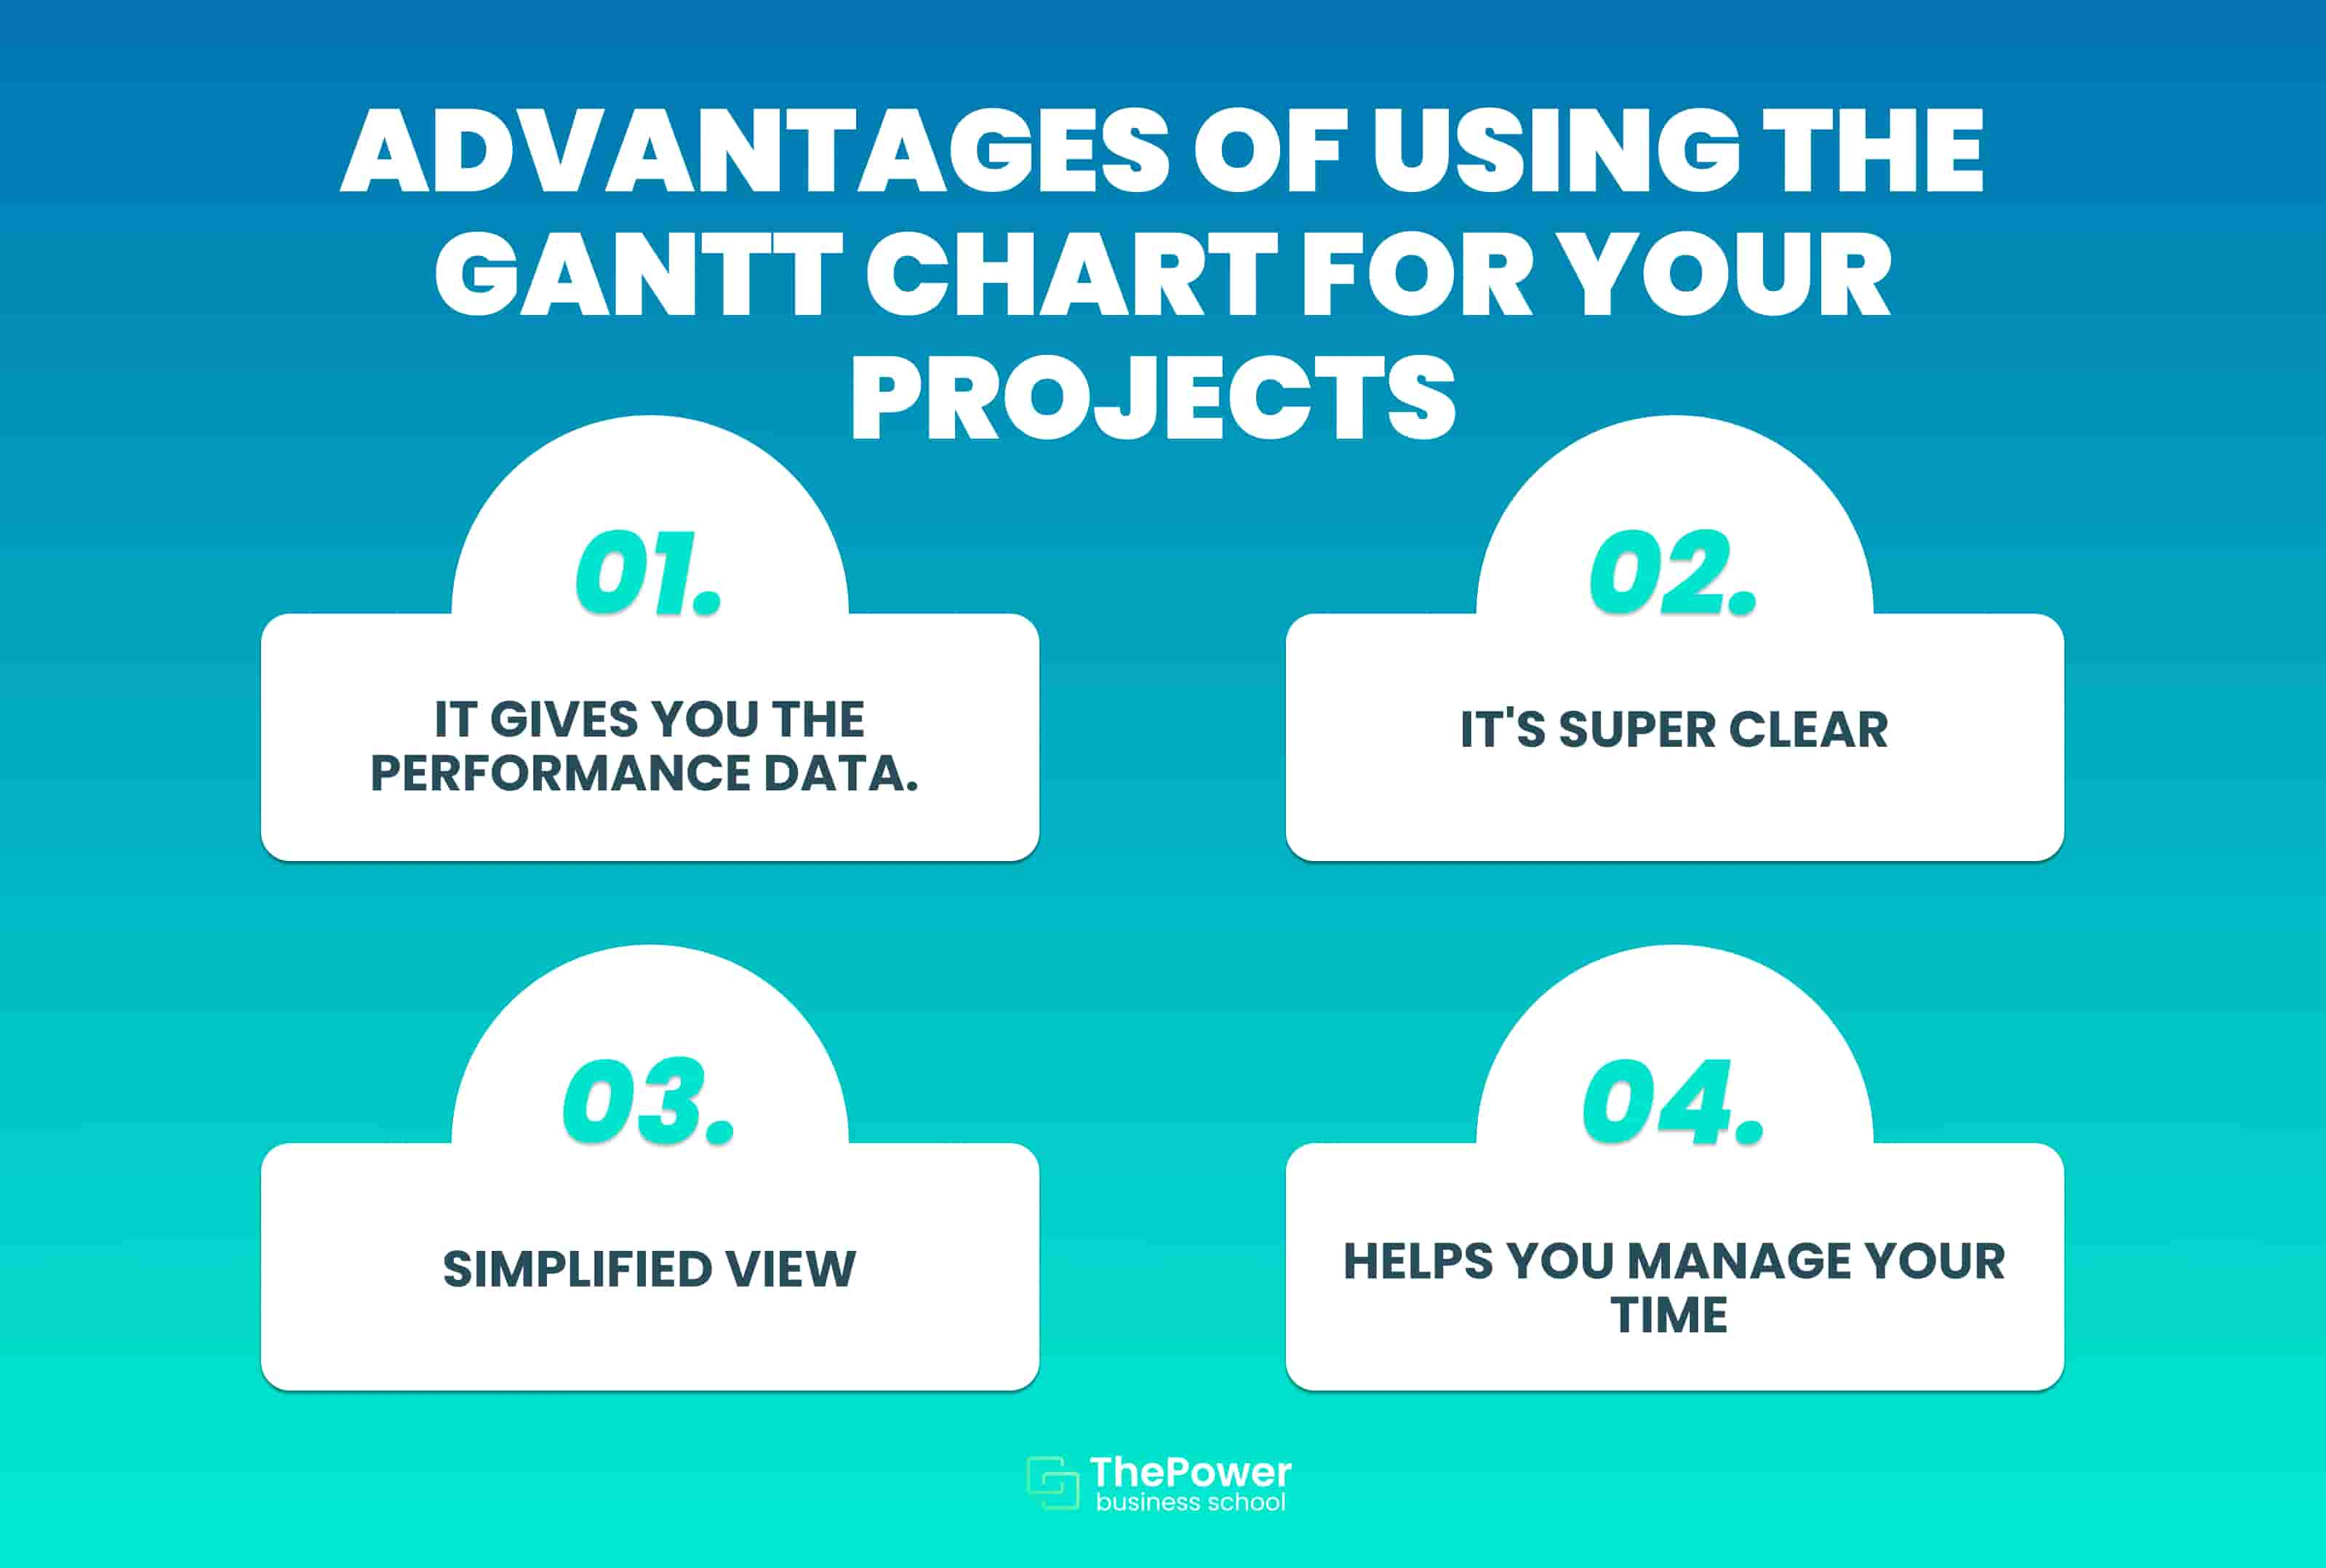
Advantages of using the Gantt chart for your projects
The Gantt chart provides you with many benefits that you should analyze. Some of them are:
1. It gives you the performance data.
First, we have the performance data.
If you go to the progress box you will see the progress of each project, task and subtask. You will also see how productive the team has been, as it shows you the completion time for each area.
From here you can make the adjustments you consider necessary, but it's a good way to evaluate the performance of your entire team.
2. It's super clear
One of the reasons we love the Gantt chart is because it gives you an overview of all the tasks that are available.
Imagine having a digital whiteboard that shows you each project along with its characteristics, delivery times and much more.
Well, that's what the diagram gives you - total clarity of your company's daily, weekly and monthly activities.
3. Simplified view
You don't need to go into each project to know which details are still to be completed.
The Gantt chart gives you an overview where you can see the summary of each of the projects that are being executed. Therefore, if you want to know the progress of a specific project, you will only have to click on the one you are interested in.
4. Helps you manage your time
How important it is to optimize your time when managing a company. The Gantt chart can help you in this regard.
In each project you will be the one to set the time frame, either because you have chosen it or because your superiors imposed it on you.
Once you have done this, bars will appear that indicate the period you have available to deliver the task. This will turn it into a portable agenda that you can take anywhere.
How to create a gantt chart
Have you already decided to create a Gantt chart? Follow the steps below:
1. Make your task list
First, write down all the tasks you have to perform for the project to be completed successfully. Don't forget the deadlines and the team that will be in charge.
Then, to make the work easier, you can divide each project into different subtasks that allow you to organize each of the activities to be carried out.
2. Classify your interdependent tasks
Interdependent tasks are those that are related to each other, so in order to do one you will have to finish another one first.
Think about it for a moment: If you want to go to work, what activities do you have to do?
You get up, brush your teeth, take a shower, get dressed and have breakfast. Then you take public transportation or use your vehicle to get to your workplace.
This way, in order to work you must do a series of interdependent tasks. The Gantt chart allows you to list them so that you can keep a strict control of each one.
3. Create a timeline
The timeline is indispensable because it allows you to determine how many hours or weeks it will take you to complete the project.
To be as precise as possible, we recommend that you check the history of previous activities, since they often suffer delays that you can prevent. This way you will know how long it might take and you will have a much more flexible schedule.
4. Assign projects
Don't forget to assign each project to the team that you think is best qualified for the activity.
It's a good idea to take another look at the task log to see if there is a member who tends to fall behind on deadlines. The idea is to assign each task to the people who have the necessary qualities and the Gantt chart will be very helpful.
There's no doubt that this diagram is one of the most important tools you can implement in your company to improve productivity. Don't forget to add all the areas in the excel cells so that all your projects are reflected in the diagram.
Have you already started using the Gantt chart? Tell us about your experience in the comments.


